Collectors running
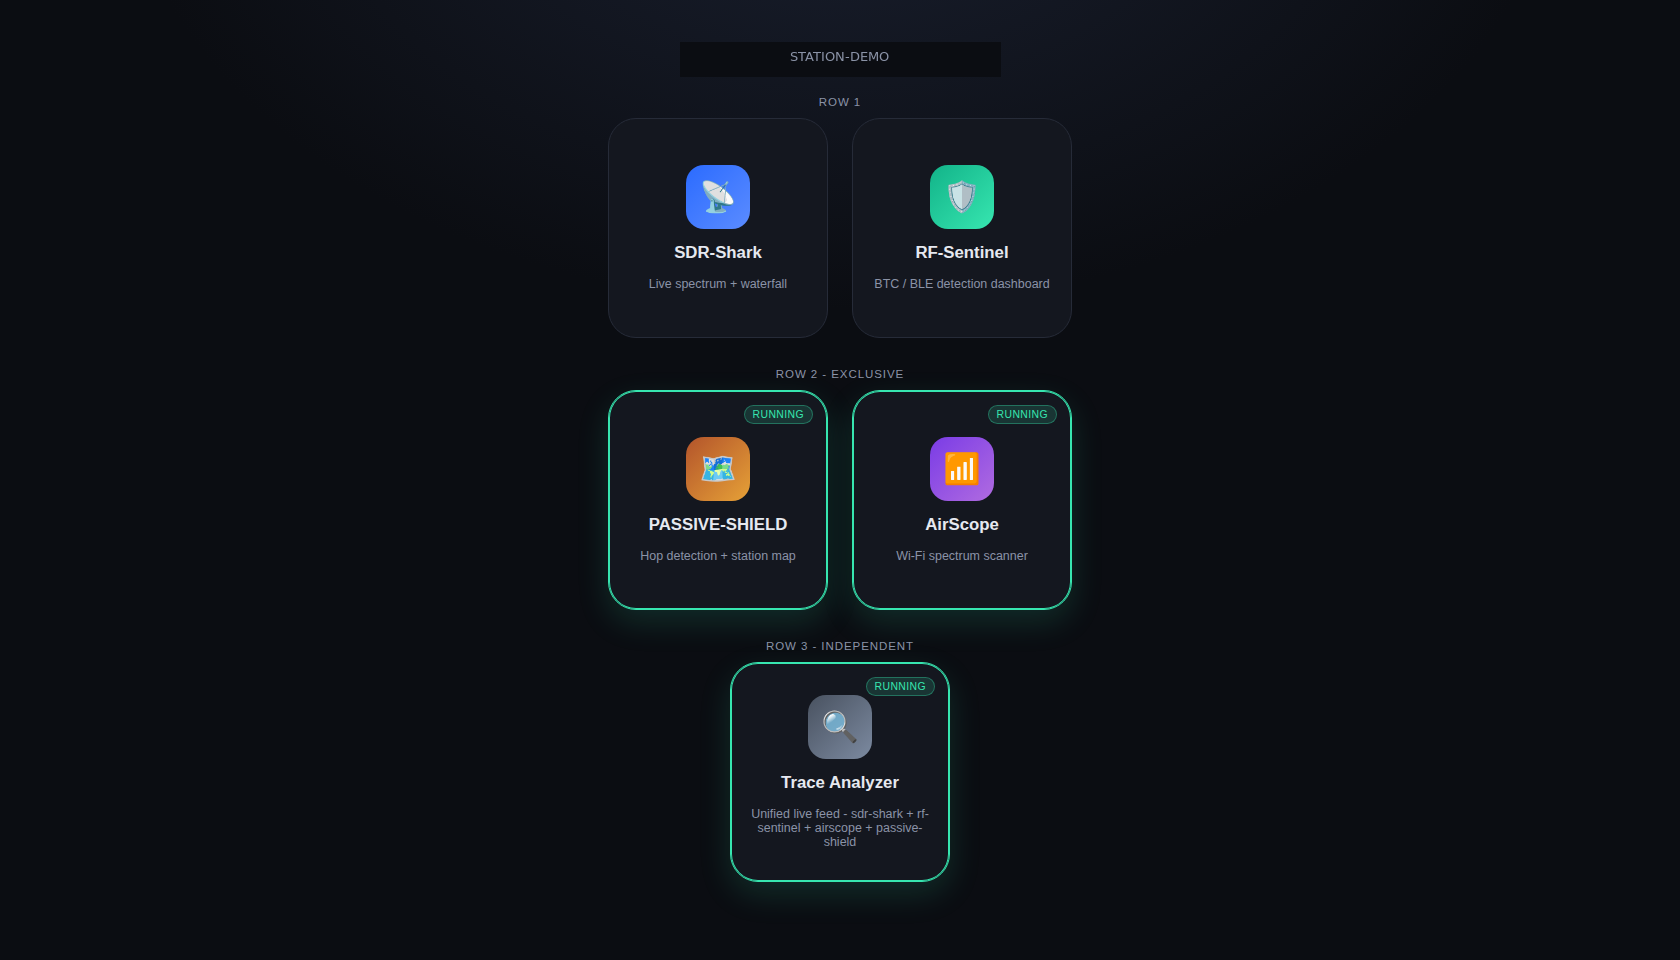
The launcher shows SDR-Shark, RF Sentinel, AirScope, PASSIVE-SHIELD, and Trace Analyzer as one coordinated toolchain.
Integration Demo
Collectors run, events enter Trace Analyzer, an entity recurs, WiFi topology expands, and cellular survey context becomes reviewable - captured through public-safe module screenshots and mock event sequences.
Integrated sequence
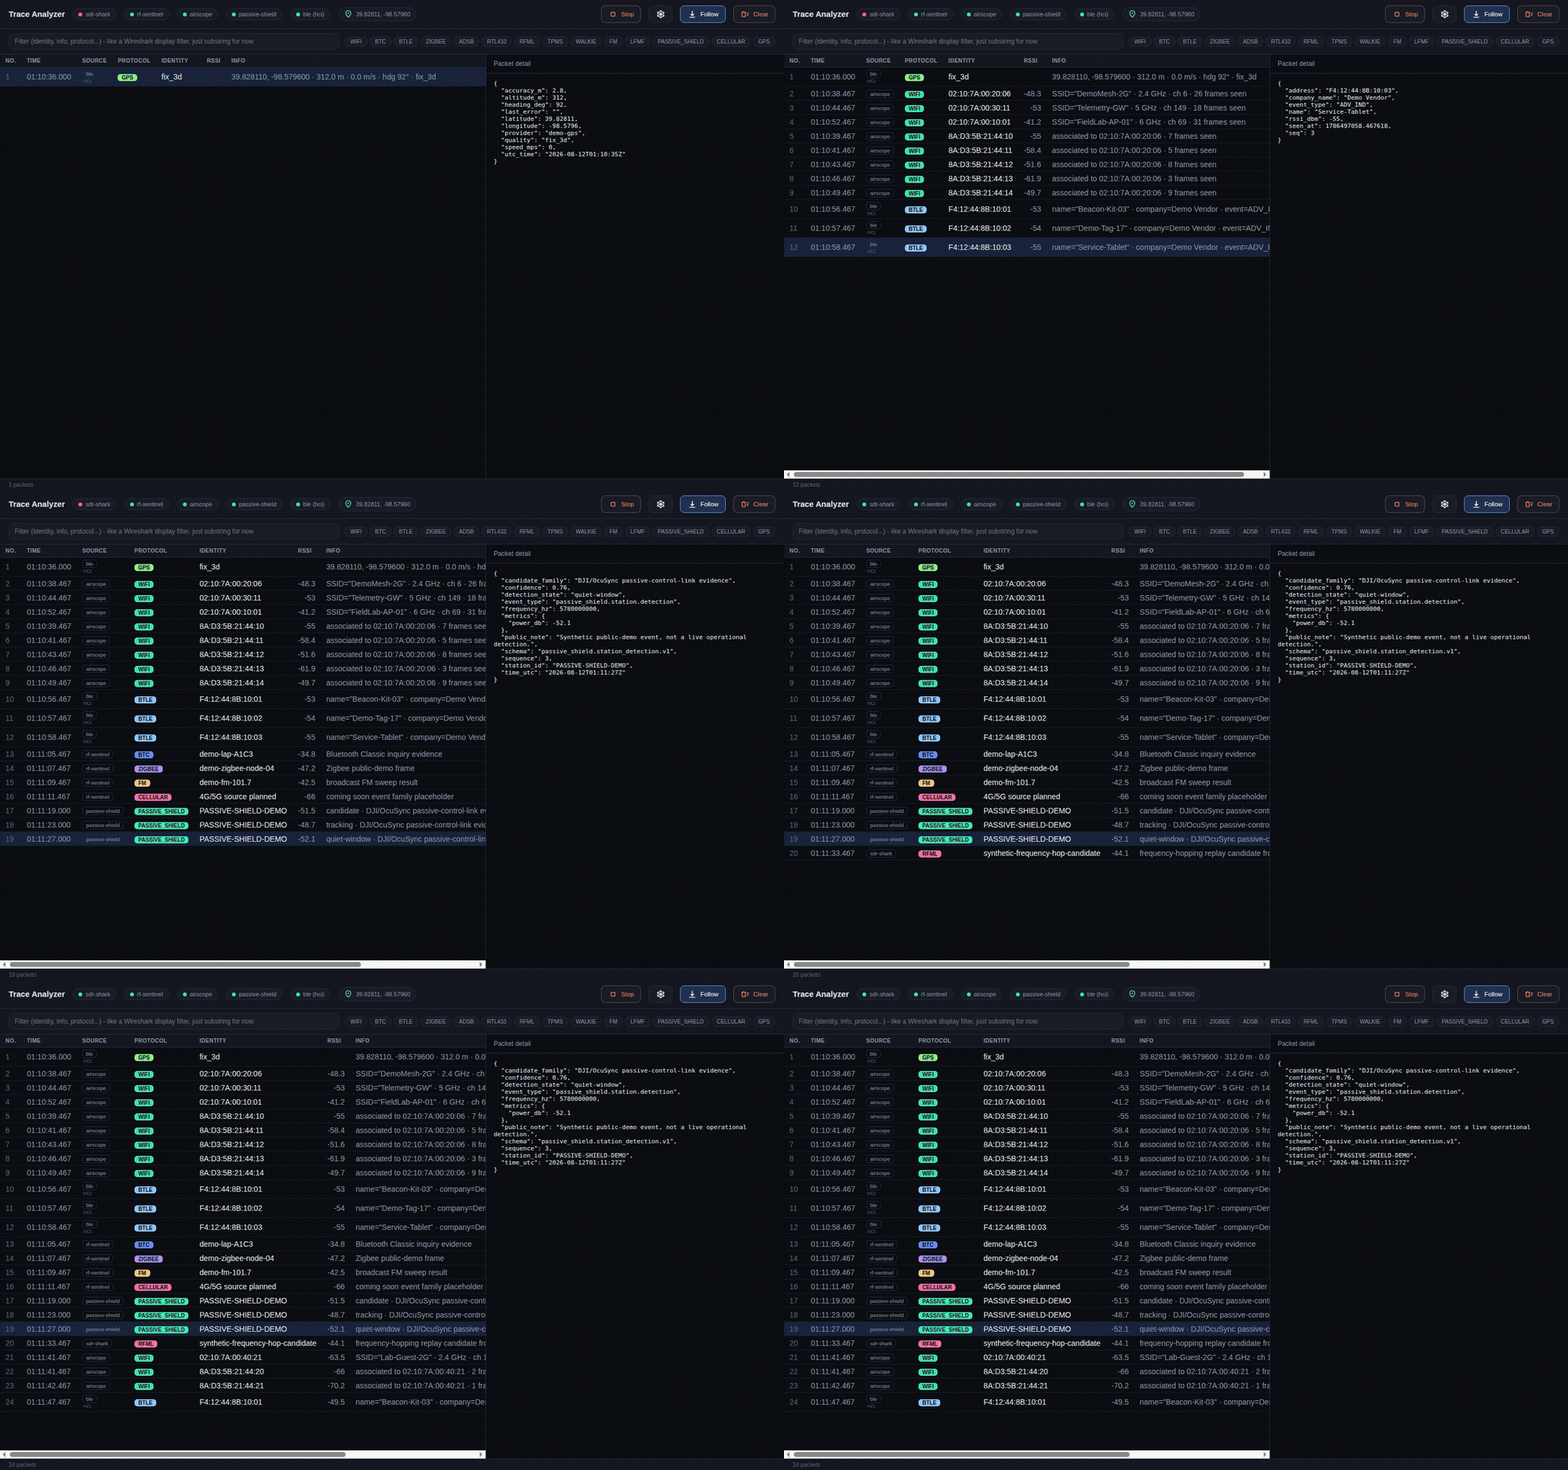
Steps 1-4 are one continuous capture from the real Trace Analyzer app and launcher, using a public-safe mock event sequence (see the GIF below). Steps 5-6 use real captures from AirScope, RF Sentinel, Cellular Survey, and PASSIVE-SHIELD module sessions to show the broader operator workflow.
The launcher shows SDR-Shark, RF Sentinel, AirScope, PASSIVE-SHIELD, and Trace Analyzer as one coordinated toolchain.
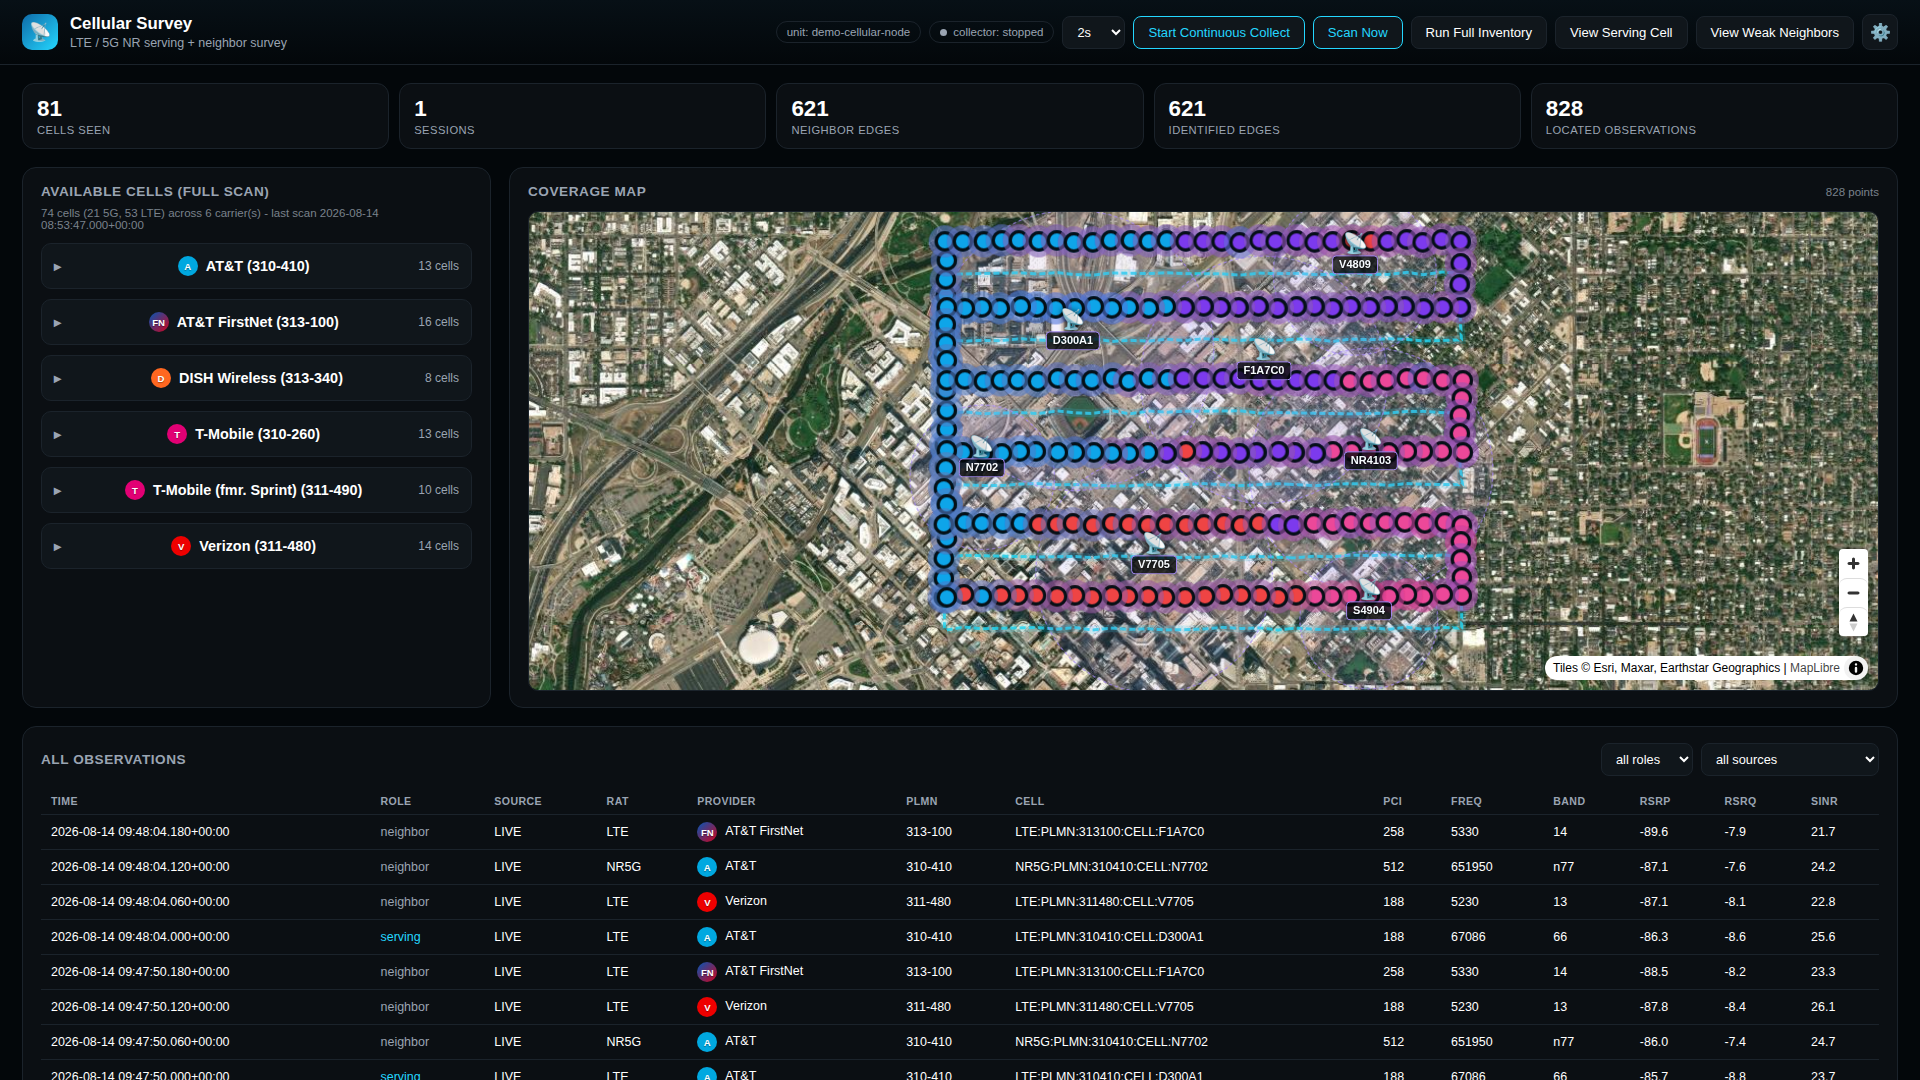
Trace Analyzer receives source-aware BLE, GPS, WiFi, cellular survey, RF, spectrum, and mission events.
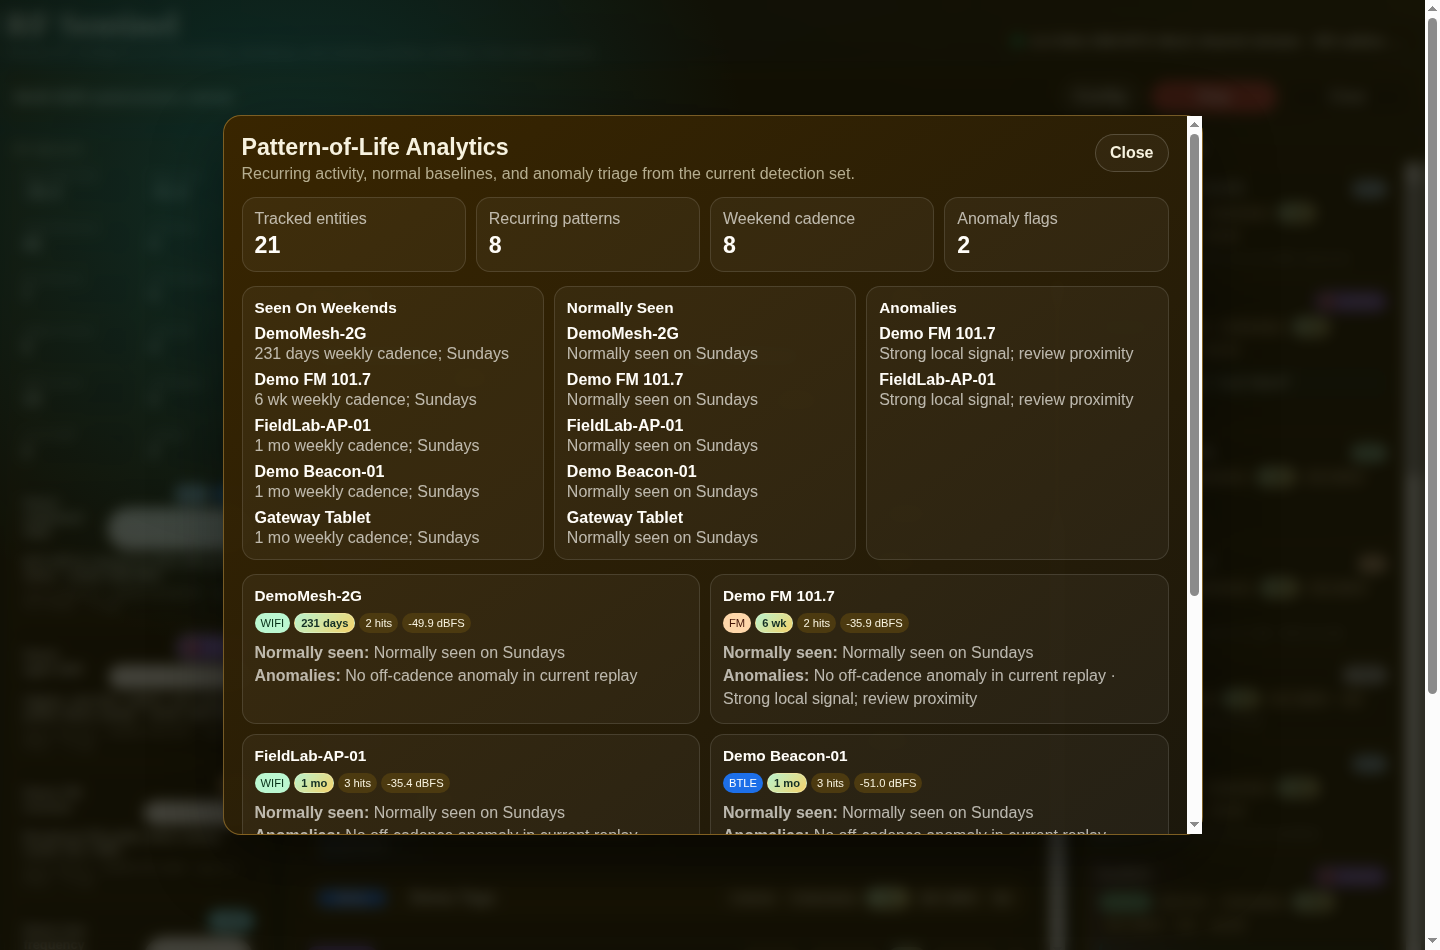
A BLE device reappears later in the same Trace Analyzer session; RF Sentinel analytics show repeat appearances, normal cadence, and out-of-pattern behavior over longer runs.
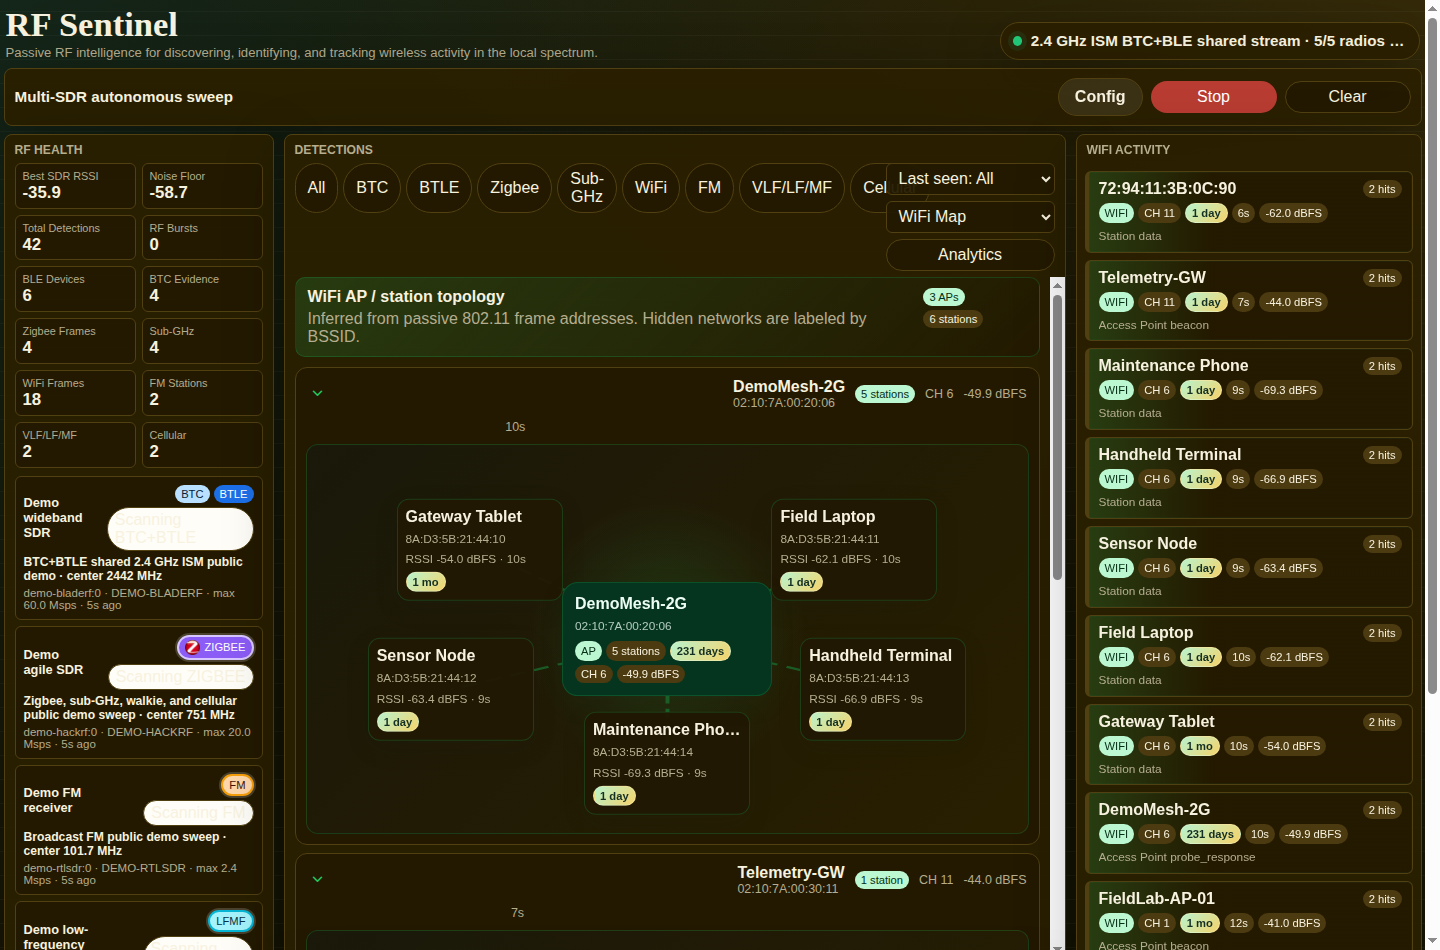
WiFi AP and station relationships expand in the same session, revealing infrastructure and connected-device context as it grows.
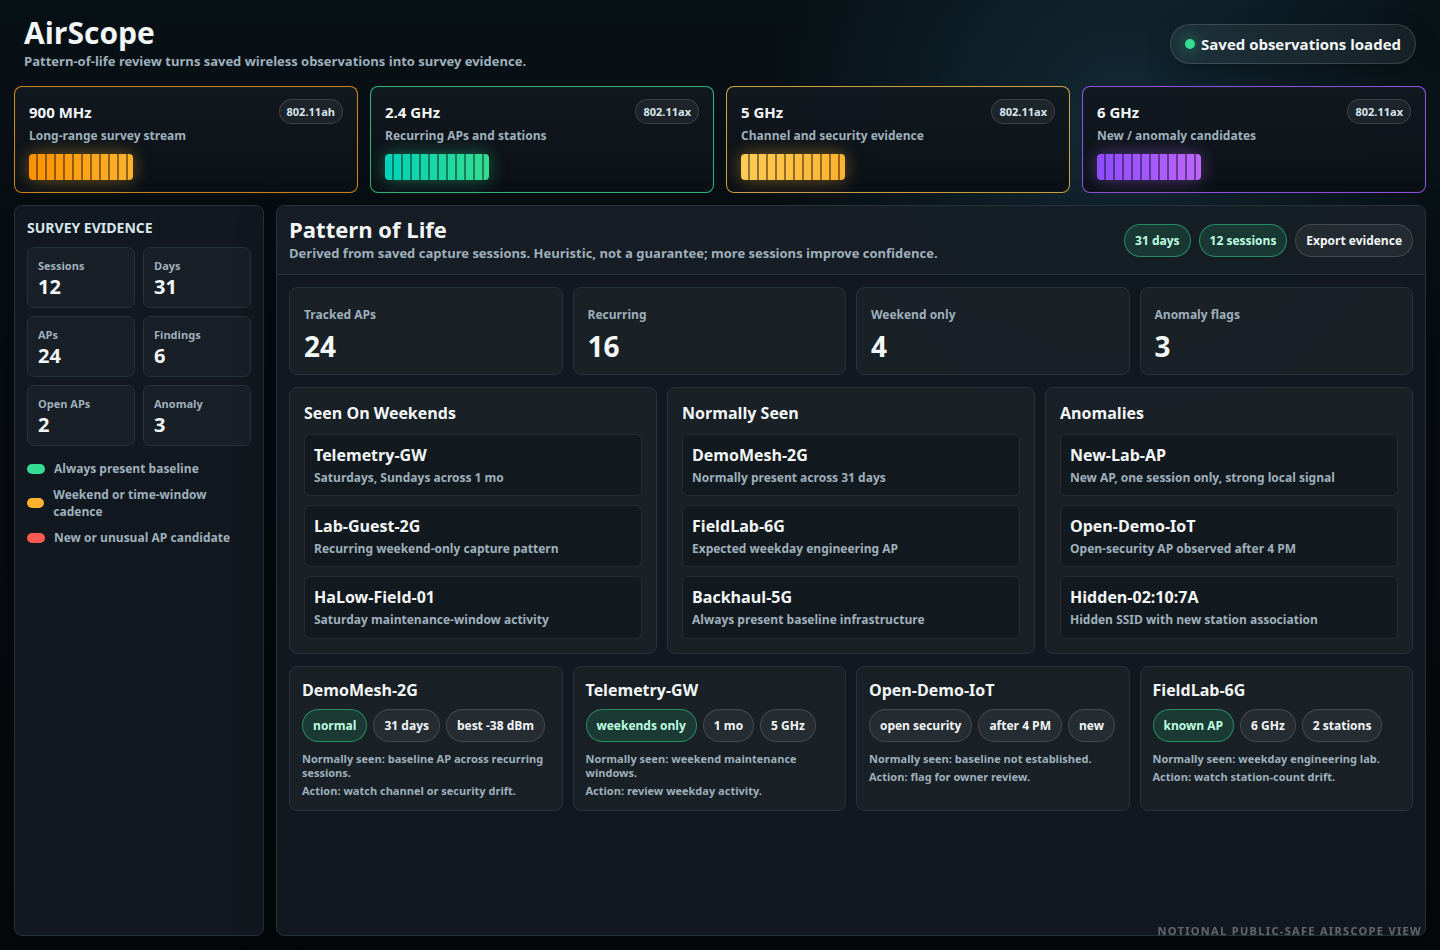
AirScope Pattern-of-Life review shows recurring APs, missing or new signals, and survey-to-survey changes.
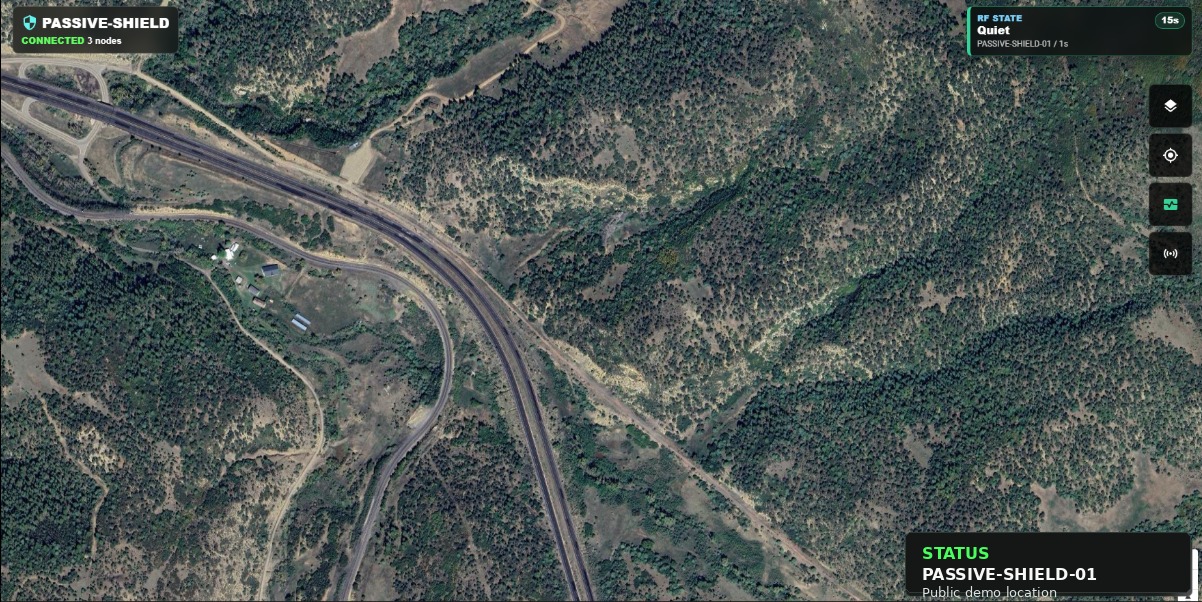
PASSIVE-SHIELD and Trace Analyzer provide mission cue context with careful prototype boundaries.
Evidence frames
Why it matters
The sequence shows why a team would pay for the platform work: fewer isolated review steps, clearer baselines, faster triage, cross-sensor correlation, repeatable evidence, and a more realistic path from prototype to field evaluation.